top of page

PRODUCT DESIGN ・CLIMATE DESIGN・DEVELOPER HANDOFF
A gamified social experience to promote use of public transport to mitigate carbon emissions


Pitch Video

High-Level Solution

Solution-specific

Exploring Solution Space
A few keywords stood out to us and we wanted them to be at the heart of this project. Using those, we explored a few specific solutions spaces.
Insights from Key actors

Why BARTable
We reached out to BARTable team to deploy ‘Quest’ in our very own Bay area to test the impact. We reached out to the team and through weekly calls, reviewed and iterated on the platform. Currently, the handover has been done and is ready to develop. BARTable’s existing and constantly updating database of articles & blogs of various activities around the city was a leverage point to develop ‘Quest’ routes and tasks.


'Quest' Mission Statement

The Design System


Talking to an Expert
Katie Patrick
Environmental Engineer -San Francisco, CA
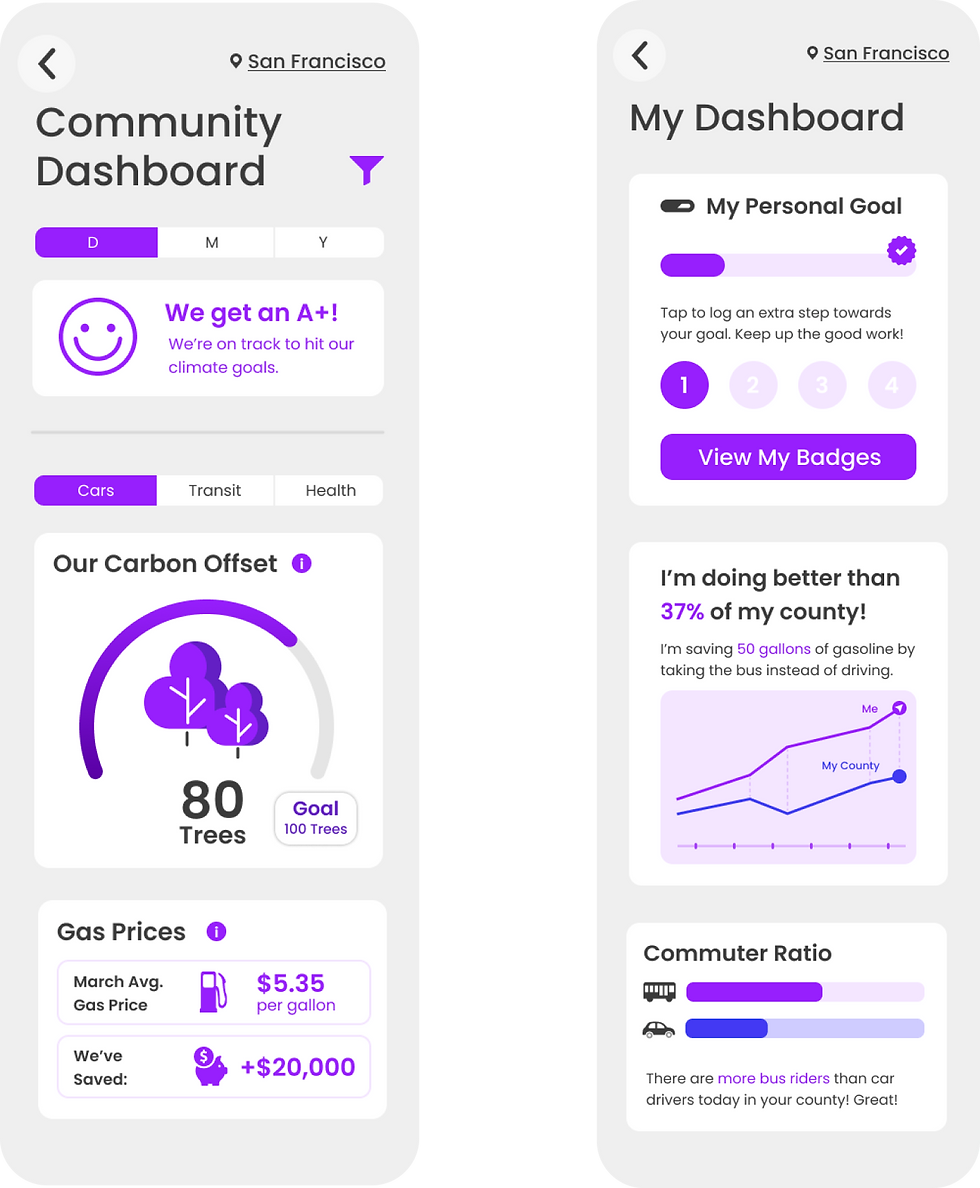
Katie specialises in how to use behavior and gamification design to create rapid environmental change. We consulted with her on the community dashboard and she had a unique perspective on the data we included. With her professional experience, she suggested that people are motivated by personal goals. This drove our decision into including a personal pledge as a part of the experience.


Applying Insights to Design
Creating ‘My Dashboard’ personalized with user’s self-set goals and comparing eco-performance against others in the same county.
Allowing people to self-identify with preferred modes of transit and set goals according to comfort level + transit familiarity, encouraging drivers to experiment with public transit more often and hit ride goals.

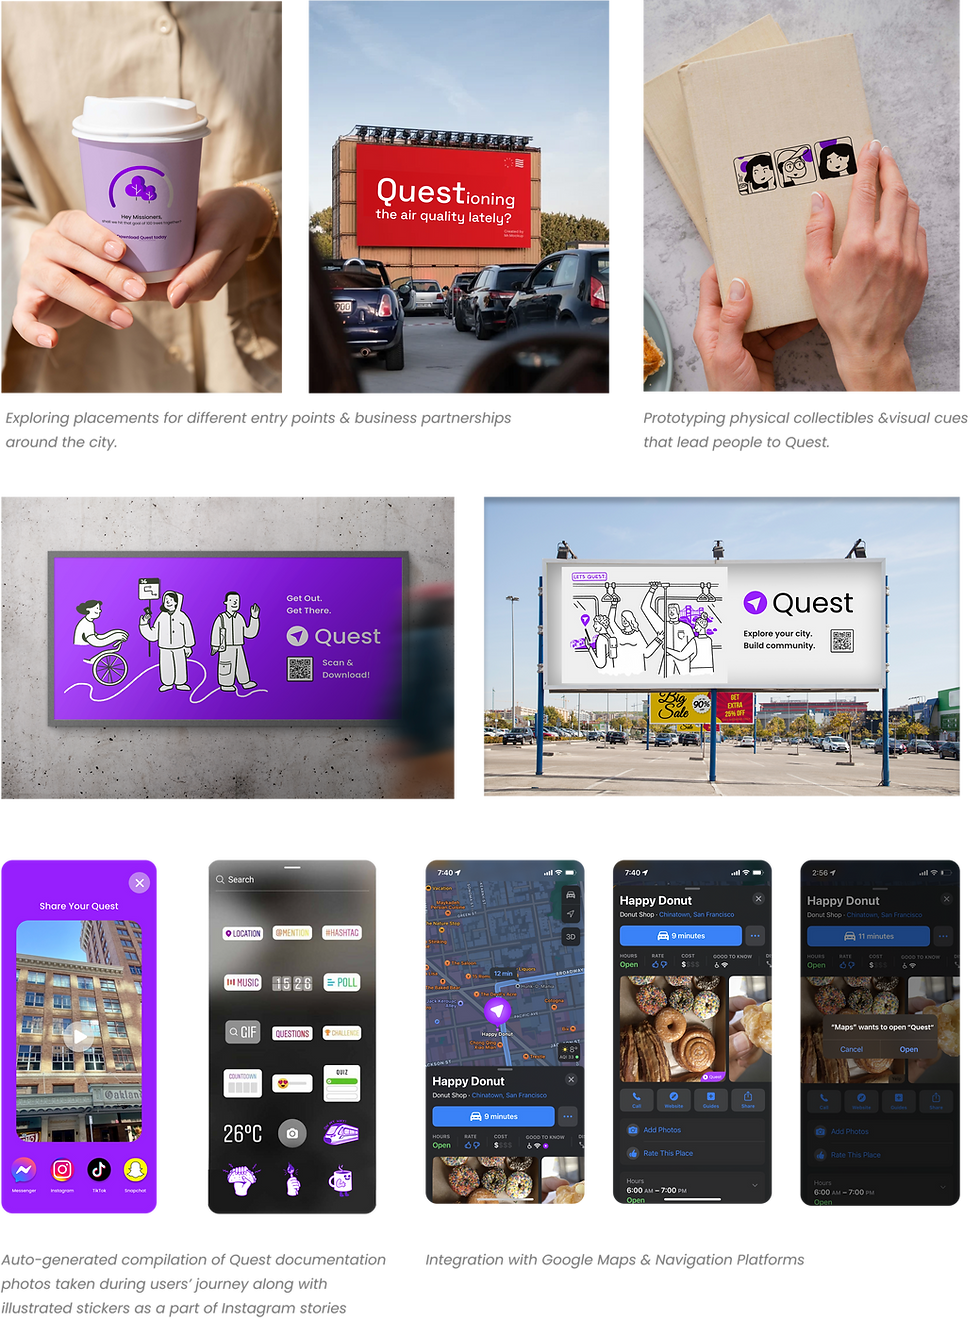
Entry Touchpoints
We explored a few digital and a few physical entry points for discovery of Quest.

Retention Strategy
In order to retain the users to keep them engaged with the platform, we came up with a reward system where one can have unique badges as collectibles every time one finishes a Quest route. There will also be new Quest routes introduced exclusively occasionally and collectible badges customised to these events!

Storyboard
To envision how the experience will play out beyond the screen, we sketched out a storyboard from the perspective of Anjali and her end-to-end experience navigating the Quest ecosystem.

CONCLUSION
Measuring Impact
To determine the success and impact ‘Quest’ has made, we identified a few tangible parameters to quantify the outcome. A few of them being -

Apart from quantitative parameters, we also identified a few qualitative parameters that will determine the impact the platform has made.

The primary next step is for the BARTable team to develop this platform in the scope of their budget.
For the plausible future, the reason why we consciously chose to keep ‘Quest’ a standalone app and not a part of BARTable was for the main reason of scalability across various urban settings keeping in mind that it can be adapted across different systems of public transport across the globe with the mission to drive a mindset change amongst communities to chose a more environmentally kind mode of mobility and transport!
Next Steps
MY LEARNINGS AND TAKEAWAYS
(left) Me, (Right) Ruby brainstorming together

Apart from sharing a common sentiment about Climate change, the collaboration on this challenge along with my partner Ruby was a meaningful one.
We collectively overcame the roadblocks & bouncing ideas off of each other resulted in fruitful outcomes.
I can now reflect back and acknowledge the fact that I grew as a designer and it was only possible to achieve so much in such a short time because of a collaborative effort.
A slide from Marc O'Brien's presentation

As our Climate designer professor Marc says, Climate design isn’t about “Doom & Gloom” but about “Doom & Bloom” - we wanted ‘Quest’ to be an optimistic climate project!
The idea is to not bring in a new solution but rather bring attention to the existing solutions out there.
We tried to stick to this ideology and it was a learning curve as I worked on ‘Quest’ to make the platform fun and engaging enough whilst saving the world!
A slide from our pitch deck comparing affordances of color palettes

Making decisive design decisions and conveying them to the ‘client’ involved in the process is one thing that I took away from this project.
When we hit a roadblock with deciding the color palette, we had to contrast test the colors to arrive at a more rational decision and hence convince the client!
in conclusion..
Ruby and I simply want the world to be a better and kind place. We envision a place with lesser carbon emissions, where we all can breathe freely, and where people make conscious transport choices!
We did our small bit by contributing with what we do best - Design!

Lets save the planet together but make it fun!
THANK YOU!
OVERVIEW
The project focus on shifting behaviors of communities to make more conscious transport choices by shifting focus from car ownership to public transport ridership. The higher goal is to fight climate change and mitigate carbon emissions in urban settings. The project was created for San Francisco's public Transport BART keeping in mind the scalability across other urban cities globally.
Instructor
Marc O'Brien
Team
Ruby Chen
Snehal Ladke
Duration
3 Months
My Role
Design strategist, User research, Product design, Usability testing
Climate Designers is the global hub for designers and creative professionals from all industries, committed to using our creative skills for climate action. Ruby and I as a part of this collective led by Mar O'Brien, connected on our common interest in addressing carbon emissions in urban settings and pursued this project alongside San Francisco's public transport - BART.
SOLUTION
‘Quest’ is a social experience platform to discover your or a new city through scavenger hunt-like tasks panned over the city connected by public transport routes. Quest is scalable across various cities globally.
For this project, we collaborated with BARTable in San Francisco and have leveraged their database for the platform that you can find here.

The scavenger hunt
A trail of tasks spread across the city connected with public transport. The hunt is categorised in various relevant themes such as art, food, etc.
Dashboard
The dashboard reflects customized data on climate-related impact and also keeps a track of your personal goals you’d pledge to use public transport.


Self-identify with preferred modes of transit


Set goals to commit to public transit


Track your goal within the platform


Flexible filtering based on location, interests and time


Custom hand-drawn avatars to choose from!


Easy Sign up


Reviews of ‘Quest’ for authenticity


Hint feature to help complete the tasks
PROBLEM STATEMENT
Carbon emission in urban cities is affecting the Air Quality across the globe
One of the many reasons causing carbon emission is the commotion of vehicles in urban cities. We wanted to focus on mitigating the emissions by influencing behaviour change within communities to adapt to a more environmentally kind options of transportation vis-à-vis public transportation.
‘Airpocalypses’ in Beijing, Feb 2022.
Photo Courtesy: The economist


RESEARCH
We floated a global survey and received about 48 responses


The global survey revealed that the reasons people opt for public transportation are mainly because of proximity, economic reasons and other driving factor is social. The popular choices were events around the city such as bar crawls, concerts, or art exhibits!
Insights from Experts
Key Findings


We spoke to Kate Riordan (Senior transportation Planner at the City of Milwaukee) who gave us interesting insights into how strategy, policy-making, and city planning come into play in her city. She explained the key players and everyday in-and-outs of her jobs. This valuable conversation would be at the core of our decision-making for the scalability of ‘Quest’ across various key urban cities and how it’ll need to adapt in regard to different ecosystems.
Based on the chat with Kate, we identified the key players and all the involved ecosystems that’ll be impacted by the solution space we decide to focus on. We tried to lay it down in a form of a Systems diagram.
Every decision that public transportation of a city initiates has a ripple effect on all other inter-linked ecosystems and vice versa.
Systems Diagram

Top Challenges
To deal with this big problem impacting climate change, we identified some challenges. Apart from challenges like unequal distribution of Public Transit, the Last Mile Problem & navigation of transit maps which are high level, we decided to focus on the following challenges on which we focus our solution space -


Information Architecture the platform

Low-fidelity Wireframes
The visual identity of Quest symbolizes movement, location, and digital navigation.
The Visual Design


Community Dashboard
Community Dashboard is a crucial feature on Quest, reflecting the impact and keeping a track of behavioural shift of an individual over time in regards to choosing Public transport.
We had multiple iterations for this feature - integrated all the insights from user testing and conversations with experts to reflect necessary data and stats.
Weekly feedback and review sessions with the BARTable team. We’d share our iterations with the team and incorporate their feedbacks and suggestion!
USABILITY TESTING

Going through multiple rounds of user testing from paper prototypes to mid and high-fidelity mockups.
Inquiring about participants’ understanding of the experience and what they expect/ what their values and goals are.

Developer Handoff
Because of time constraints, we were needed to hand-off the designs to developers without direct communication. So, to over come this challenge, we thoroughly labelled out Figma hand-off document with specific navigation instructions. We also walked them through the whole product through a Loom video.

bottom of page
